The data questions on the AMC 8 use the easiest arithmetic on the paper and still take marks off strong students. The reason is that the mathematics is not the task — reading is. This card gives you exact definitions with their edge cases, the five display types and what each one makes you compute, nine worked examples with a full answer key, and a twelve-minute weekly drill.
Why this strand behaves differently from the rest of the paper
On an algebra question you can tell you are stuck. On a data question you almost never feel stuck — you feel finished. You read a chart, you subtract two numbers, you find your answer among the five choices, and you move on inside forty seconds. That is exactly the failure mode: the answer to the question you solved is often one of the distractors for the question that was printed.
Three structural features cause it. First, the numbers are small, so nothing in the arithmetic warns you. Second, the information lives in two places at once — the picture and the caption, or the axis and the key — and skipping one of them still produces a clean-looking number. Third, the vocabulary is deceptively familiar: average, middle, most common and spread all have precise contest meanings that are slightly narrower than the everyday ones.
The exam gives you 40 minutes for 25 questions with no calculator, and it is sat in person on paper — the conditions are set out in our guide to the in-person January AMC 8. So a data question is not a place to spend extra time; it is a place to spend your time in the right order. Read the labels before the numbers, every time.
The four measures, with their edge cases
Learn the third column. That is where the marks are, and it is the part school lessons usually pass over quickly.
| Measure | Exact definition | The edge case that costs marks | What moves it |
|---|---|---|---|
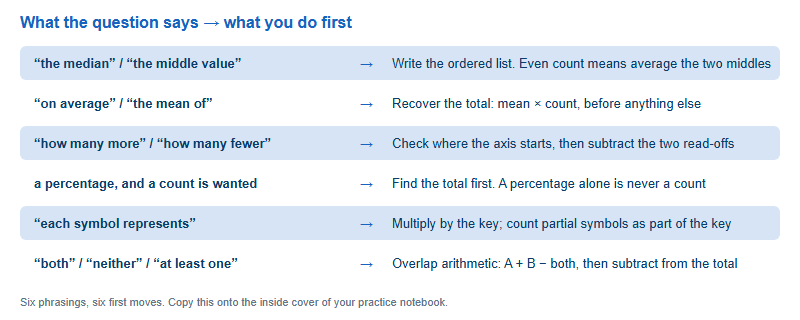
| Mean | Sum of all values divided by how many values there are | You cannot average two means unless the groups are the same size. Recover the totals first | Every value, including outliers. Adding a value equal to the current mean leaves it unchanged |
| Median | The middle value once the list is in order | With an even number of values there is no single middle — take the mean of the two middle ones. The answer may not appear in the list | Only the middle of the order. A huge outlier can move the mean a long way and the median not at all |
| Mode | The value that occurs most often | A set can have no mode, one mode, or several. “The mode” in a question does not guarantee uniqueness — count the frequencies | Repeats only. Changing a value that appears once may change nothing |
| Range | Largest value minus smallest value | It is a single number, not an interval. “From 4 to 15” is not the range; 11 is | Only the two extremes. Everything in the middle is irrelevant |
One more relationship is worth memorising because it turns two-step questions into one-step questions: mean × count = total. Nearly every “what must the last score be” question is that identity used twice — once to recover the old total, once to build the target total.
The five displays, and what each one hides
| Display | What it gives you directly | What it makes you compute | The trap |
|---|---|---|---|
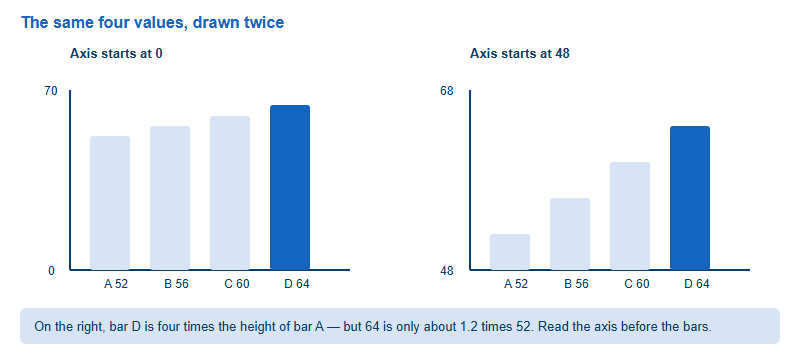
| Bar chart | A value per category, read off the axis | Differences, totals, and which category meets a condition | An axis that does not start at zero. Bar heights then have nothing to do with value ratios |
| Pictograph | A count of symbols per row | Symbols × the key, including partial symbols | Ignoring the key, or reading half a symbol as one. The key is usually one small line of text |
| Circle graph | Shares of a whole, as percentages or angles | Percent × total to get a count — so you must find the total somewhere | Comparing two circle graphs with different totals as if the percentages were counts |
| Line graph | A value at each marked time | Change between points, and where change is fastest | Unequal spacing on the horizontal axis, and confusing “highest value” with “biggest increase” |
| Table, Venn or stem-and-leaf | Exact values, already listed | Ordering, overlap arithmetic, or a total | Double counting the overlap in a Venn, and reading a stem-and-leaf row as separate numbers |
Nine worked examples, with the answer key
Cover the answers, work each one on paper, then check. These are written by us to isolate a single edge case each — they are not taken from any past paper. If you want to combine them with real timed practice afterwards, do it inside a full paper rather than as loose questions.
| # | Question | Answer | The move being tested |
|---|---|---|---|
| 1 | Find the median of 4, 7, 7, 9, 12, 15 | 8 | Even count: mean of the two middle values, 7 and 9. The answer is not in the list |
| 2 | One more 9 is added to that list. What is the mode now? | 7 and 9 | Two modes. A question that says “the mode” still requires you to count frequencies |
| 3 | What is the range of 4, 7, 7, 9, 12, 15? | 11 | 15 − 4. A single number, not the interval from 4 to 15 |
| 4 | Five tests average 82. What is needed on a sixth test for a six-test average of 84? | 94 | Totals, twice: 5 × 82 = 410, then 6 × 84 = 504, so 504 − 410 = 94 |
| 5 | A pictograph key says one symbol represents 4 books. A row shows three and a half symbols. How many books? | 14 | Multiply by the key, and treat the half symbol as half the key value |
| 6 | A circle graph shows 15% chose swimming, out of 60 students. How many chose swimming? | 9 | A percentage is not a count until you multiply by the total |
| 7 | In a class of 30, 18 play football and 14 play chess; 5 play both. How many play neither? | 3 | 18 + 14 − 5 = 27 play at least one, so 30 − 27 = 3 |
| 8 | A value equal to the current mean is added to a data set. What happens to the mean? | Unchanged | Both the total and the count grow in the same proportion |
| 9 | Compare the mean and the median of 2, 3, 4, 5, 86 | Mean 20, median 4 | One outlier drags the mean far above every value but one, and leaves the median where it was |
Example 9 is the one worth sitting with. A question that asks which measure “best represents” a data set is really asking whether an outlier is present, and the honest answer for a skewed set is the median. That is a reasoning question dressed as an arithmetic question, and it is the kind that appears further along the paper.
Twelve minutes a week, and a self-check grid
This strand does not need long study blocks. It needs a short, repeated routine that hardens the reading order.
- Four minutes — label-first reading. Take any four charts from a past paper. Do not answer them. For each, write down three things only: what the axis measures, where the axis starts, and what the key says. If a chart has no key, write “none”. The aim is to make label-reading automatic rather than optional.
- Four minutes — the totals drill. Write five “mean and count” pairs and convert each to a total in your head. 6 values averaging 15; 8 values averaging 12; and so on. This is the identity behind most multi-step mean questions, and it should not cost you thinking time.
- Four minutes — the edge-case sweep. Write one data set of your own and answer four questions about it: median with an even count, mode when two values tie, range, and what happens to the mean when you add the largest value again. Change the set each week.
Track it with a grid of four columns — date, chart type practised, edge case tested, and one line on what went wrong. After a month you will see whether your losses are concentrated in reading (axis, key, total) or in the definitions (median, mode). Those two problems have entirely different fixes, and guessing which one you have is how students waste revision weeks.
One pattern from our own marking, offered as an observation rather than a statistic: in the data strand the most common surviving error is not a wrong calculation but a right calculation applied to the wrong quantity — a percentage reported as a count, or a difference read off a truncated axis. Results vary between students, but the diagnosis is usually visible in the working, because the arithmetic is correct and the label is missing.
When you move from topic drills into full timed papers, do it under real conditions — the sitting is in person, on paper, with no calculator, inside a January window published by the MAA. Our guide to the in-person January AMC 8 sets out what the day itself looks like for China-based families, and it is worth reading before you plan your first full mock, because a mock that does not match the real conditions trains the wrong habits.
Frequently asked questions
Can a data set have more than one mode?
Yes. It can have none, one, or several. Count the frequencies rather than assuming the question guarantees a single answer.
Do I need the total to answer a circle-graph question?
If the question wants a count, yes. A percentage becomes a count only when multiplied by the total, which is stated somewhere.
Why does my answer differ when I compare bar heights?
Almost always a truncated axis. Read where the vertical axis begins before comparing any two bars.
How many data questions appear on the AMC 8?
It varies by year rather than following a fixed per-topic count. Confirm the current format on maa.org and practise the strand as a whole.
This is an independent guide operated by Hanlin Education for China-based international-school students. We are not affiliated with, endorsed by, or sponsored by the Mathematical Association of America (MAA). Competition dates, eligibility, formats and awards are set by the MAA — confirm current details on maa.org, and confirm sitting arrangements with your test centre. Errors reported to us are corrected within 7 working days.